Dynamic profiler needs no instrumentation
Oct 2, 2007 — by LinuxDevices Staff — from the LinuxDevices Archive — 11 views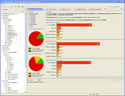 At its Developer's Conference today in Santa Clara, Calif., ARM unveiled a dynamic analysis tool said to require no instrumentation, among other interesting features. The “RealView Profiler” runs as an Eclipse plug-in, and can profile virtual or actual hardware for unlimited test periods, the company… claims.
ARM says the Profiler tool can help developers quickly and easily identify performance bottlenecks in their code, enabling them to optimize their applications for either performance or size. Gains of about 20 percent are typical, according to the company, even for users without deep knowledge of the applications they are optimizing.
When used to profile real hardware, the profiler requires the presence of ARM's “Embedded Trace Macrocell” (ETM) on-chip debugging interface. It also requires ARM's RealView Trace 2 probe. Data are streamed from the target system to the development host for analysis, with “unlimited” periods of analysis supported on target processors clocked at 250MHz or below, the company claims. Initially supported target processors include devices with ARM926EJ-S, ARM1136JF-S, ARM1176JZF-S, and Cortex-R4 cores, plus the ETM interface.
The profiler can also be used to profile virtual hardware, using ARM's “Real-Time System Models,” ARM said.
Unlike typical dynamic profiling tools, no code instrumentation is required. Thus, the tool can be used to profile optimized, production code on actual hardware lacking the headroom for instrumentation or on-system data storage, according to ARM.
The RealView Profiler includes a suite of graphical analysis tools designed to list the top five application “hot-spots” — places in the application where optimization is most likely to prove beneficial. Disassembled machine code is associated back with the original source, a feature said to be critical when using third-party applications. The screenshots below also feature the RealView Profiler's “call graph,” another graphical view of the executing code.

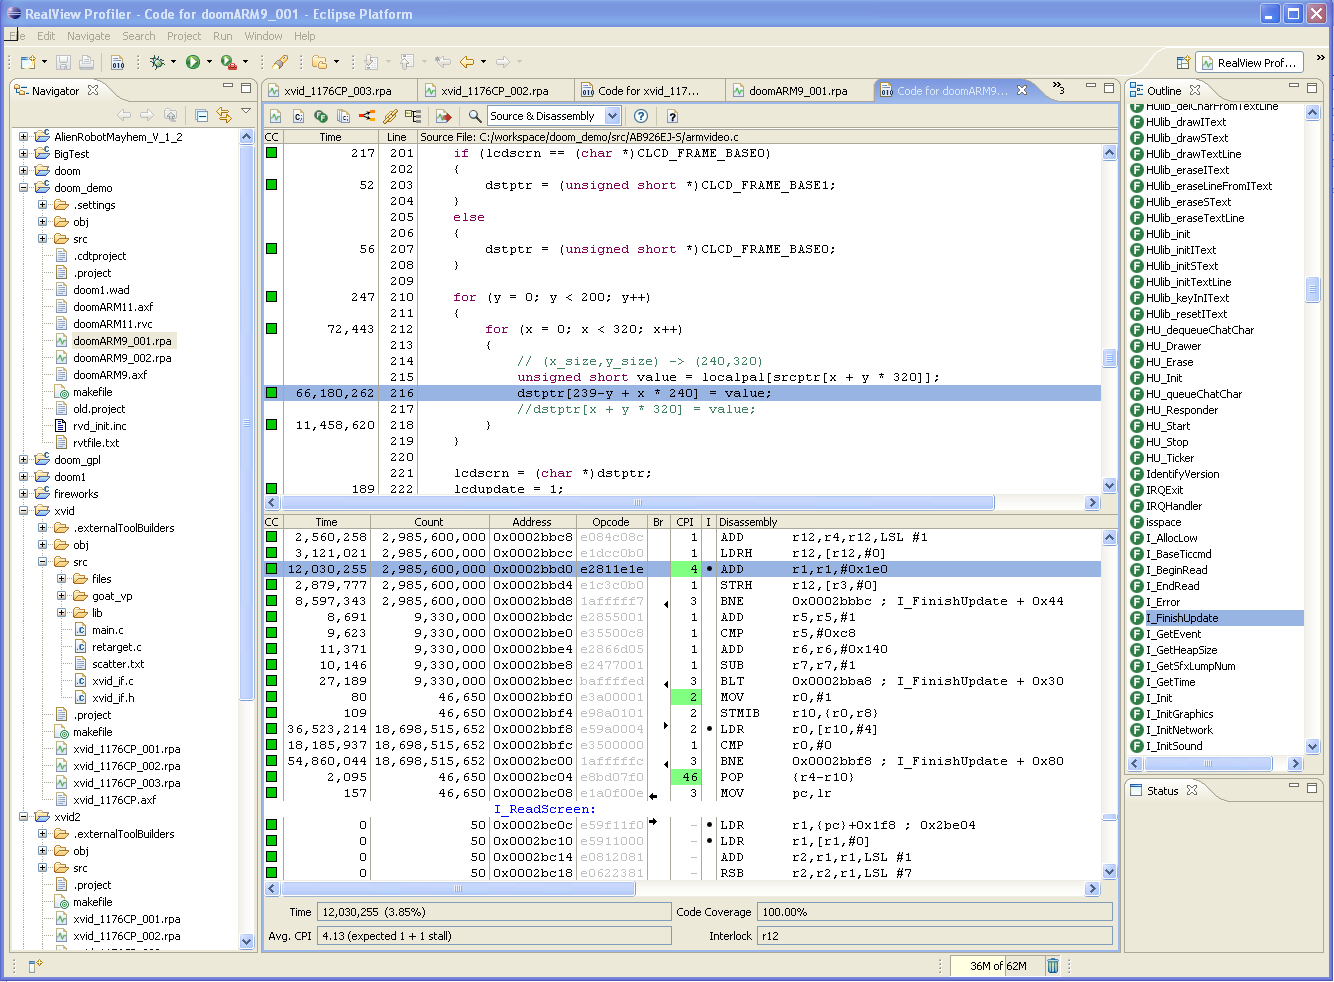
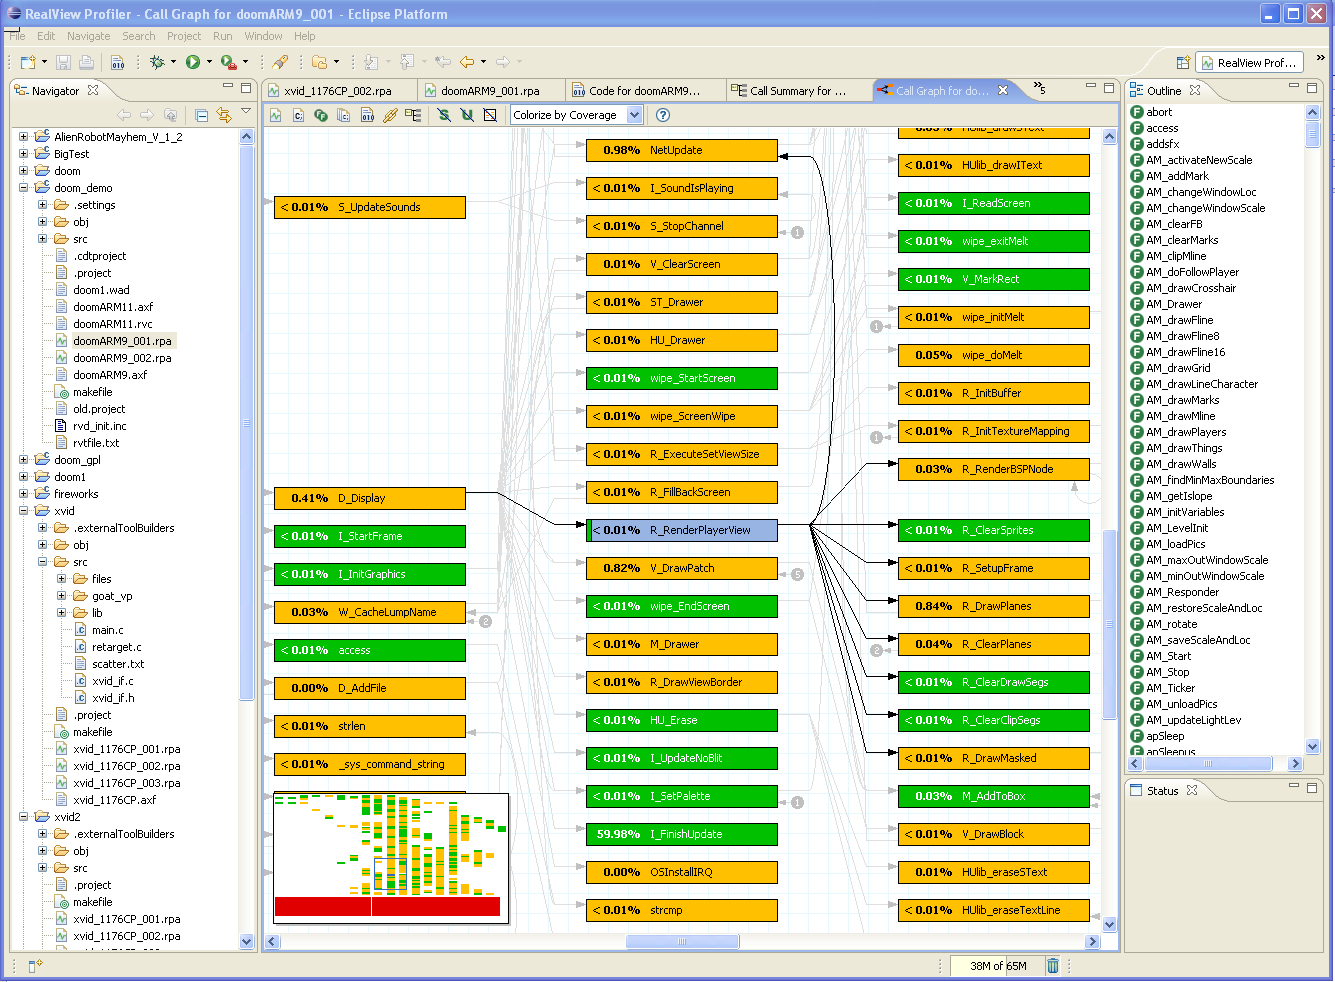
RealView Profiler screenshots
(Click each screenshot to enlarge)
Additional touted profiler features include:
- “Comprehensive” analysis of both statement and branch code coverage
- Helps testers achieve and demonstrate 100 percent code coverage
- Can be used from the earliest stages of software development
- Supports many compilers, including GNU tools and RealView tools
- Provides information for both executed machine instructions and original source code
- Especially beneficial when used with third-party software, ARM says
- CPU interlocks, unexpected instruction delays, code efficiency, and low-level instructions views mapped back to software developer's source code annotated with performance information
- Initial support for ARM926EJ-S, ARM1136JF-S, ARM1176JZF-S, and Cortex-R4 processors
John Cornish, ARM's VP of marketing, stated, “The consumer electronics market requires increasingly complex applications delivering rich media content, making embedded software performance and quality an absolute imperative. The RealView Profiler supports non-intrusive analysis of software performance and code coverage of real system workloads, and provides critical insights and hot spot information. This enables developers to quickly optimize their code for both performance and code coverage and makes it the ideal product to test and measure production level embedded software.”
The RealView Profiler is available now, with initial support for ARM926EJ-S, ARM1136JF-S, ARM1176JZF-S, and Cortex-R4 processors equipped with ARM's Embedded Trace Macrocell (ETM). Also newly available is the RealView Trace 2 probe, said to work at 250MHz with the profiler, or at 400MHz with ARM's standard RealView 32-bit debugger. Pricing was not disclosed.
This article was originally published on LinuxDevices.com and has been donated to the open source community by QuinStreet Inc. Please visit LinuxToday.com for up-to-date news and articles about Linux and open source.