Article: Debugging with Eclipse
Nov 7, 2003 — by LinuxDevices Staff — from the LinuxDevices Archive — viewsThis article gives you an overview of how you can use the built-in debugging features in the Eclipse Platform for debugging your software projects. It covers debug view, Java debugging, setting break points, conditional break points, evaluating expressions, viewing variables, hot-swap bug fixing, remote debugging, debugging other languages, and more. In particular, although the article focuses on using Eclipse for debugging Java apps, the same Eclipse debug view is also available for the C and C++ programming languages.
Debugging is something that programmers can't avoid. There are many ways to go about debugging, but it essentially comes down to finding the code responsible for a bug. For example, one of the most common errors in Linux applications is known as a segmentation fault. This occurs when a program attempts to access memory not allocated to it and terminates with a segmentation violation. In order to fix this kind of error, you need to find the line of code that triggers the behavior. Once the line of code in question has been found, it is also useful to know the context in which the error occurs, and the associated values, variables, and methods. Using a debugger makes finding this information quite simple.
The Eclipse debugger and the Debug view
The Eclipse Platform features a built-in Java debugger that provides all standard debugging functionality, including the ability to perform step execution, to set breakpoints and values, to inspect variables and values, and to suspend and resume threads. Additionally, you can debug applications that are running on a remote machine. The Eclipse Platform is mainly a Java development environment, but its architecture is open to other programming languages. As you will see below, the same Eclipse Debug view is also available for the C and C++ programming languages.
The Eclipse Platform Workbench and its tools are built around the Java development tools (JDT) components. These components provide the following features to Eclipse:
- Project management tools
- Perspectives and views
- Builder, editor, search, and build functions
- The debugger
The Eclipse debugger itself exists as a standard plug-in included within the Eclipse binaries. Eclipse also has a special Debug view that allows you to manage the debugging or running of a program in the Workbench. It displays the stack frame for the suspended threads for each target you are debugging. Each thread in your program appears as a node in the tree, and the Debug view displays the process for each target you are running. If the thread is suspended, its stack frames are shown as child elements.
Before you begin using the Eclipse debugger, it is assumed that you have the appropriate Java SDK/JRE (I recommend you to use Java VM 1.4) and the Eclipse Platform SDK 2.0/2.1 installed, and that both are running without problems. In general, it is a good idea to test debugging options using the Eclipse samples first. If you want to develop and debug C/C++ projects, you will also need to get and install the C/C++ Development Tools (CDT). For links to the Java SDK/JRE, the Eclipse Platform and samples, and the CDT, see Resources later in this article. Figure 1 shows the General view of the Debug user interface.
Figure 1. General view of the Eclipse Debug View user interface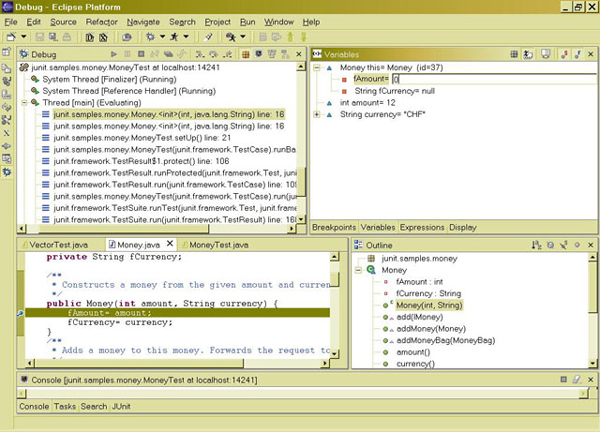
Debugging Java
Before you are able to debug your project, the code needs to compile and run cleanly. You first need to create a run configuration for your application and to make sure that it starts properly. Next, you need to set up the debug configuration in a similar way using the Run > Debug… menu. You also need to select the class to be used as the main Java class by the debugger (see also Figure 2). You can have as many debug configurations for a single project as you wish. When the debugger is started (from Run > Debug… ), it is opened in a new window, and you are ready to start debugging.
Figure 2. Setting the project's main Java class in the debug configuration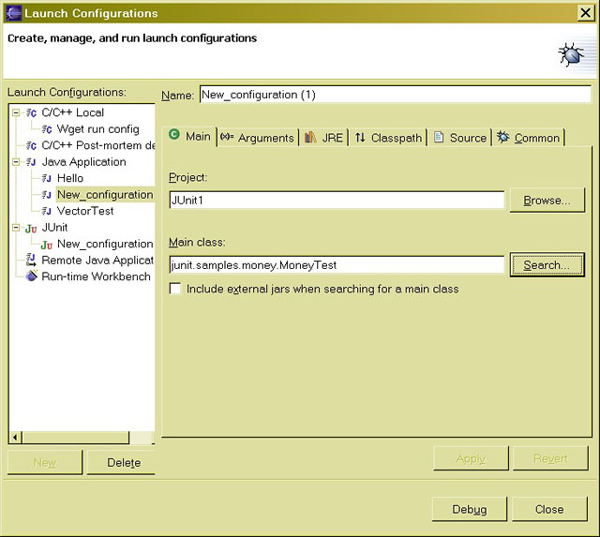
Below are example instructions for the most common Eclipse debugging operations:
Setting breakpoints
When you launch your application for debugging, Eclipse automatically switches to the Debug perspective. Undoubtedly, the most common debugging procedure is to set breakpoints that will allow the inspection of variables and the values inside conditional statements or loops. To set breakpoints in the Package Explorer view of the Java perspective, double-click the selected source code file to open it in an editor. Walk through the code and place your cursor on the marker bar (along the left edge of the editor area) on the line including the suspected code. Double-click to set the breakpoint (see also Figure 3).
Figure 3. Two breakpoints markers visible in the left margin of the editor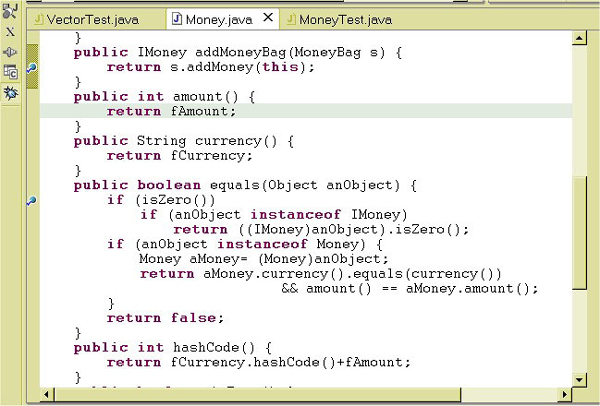
Now start the debugging session from the Run > Debug… menu. It is important not to put multiple statements on a single line because you cannot step over or set line breakpoints on more than one statement on the same line (see also Figure 4).
Figure 4. View indicates the currently executing line with an arrow in the left margin
Conditional breakpoints
Once you know where an error occurs, you will want to see what the program is doing right before it crashes. One way to do this is to step through every statement in the program, one at a time, until you reach the point of concern. Sometimes it is better to just run a section of code and stop execution at that point so you can examine data at that location. To accomplish this, it is possible to declare conditional breakpoints that are triggered whenever the value of an expression changes (see Figure 5). In addition, code assist is available when typing in the conditional expression.
Figure 5. Setting the conditional breakpoint trigger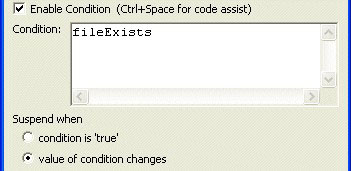
Evaluating expressions
To evaluate expressions in the editor in the Debug perspective, select the entire line where the breakpoint is set, and from the context menu, select the Inspect option (see Figure 6). The expression is evaluated in the context of the current stack frame, and the results are displayed in the Expressions view of Display window.
Figure 6. Evaluating expression with Inspect option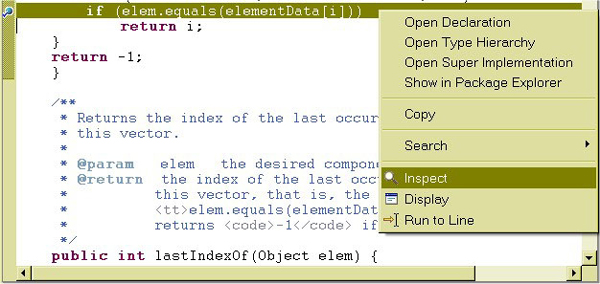
Viewing variables
The Variables view (in the Display window) displays the values of the variables in the selected stack frame (see Figure 7). To view a requested variable, simply expand the tree in the Variables view until you can see the requested element. You can also watch variables in the Variables view as you step through the code in the Debug view.
Figure 7. Viewing variables in the Display window
When the debugger stops at a breakpoint, you can continue the debugger session by selecting the Step Over option from the Run > Debug… menu (see Figure 8). This steps over the highlighted line of code and continues execution at the next line in the same method (or it will continue in the method from which the current method was called). The variables that are changed as a result of the last step are highlighted in the color (the default color is red) specified in “Changed Variable Value Color” preference (specified in the Debug Variable Views).
Figure 8. Debugger commands in the Run… menu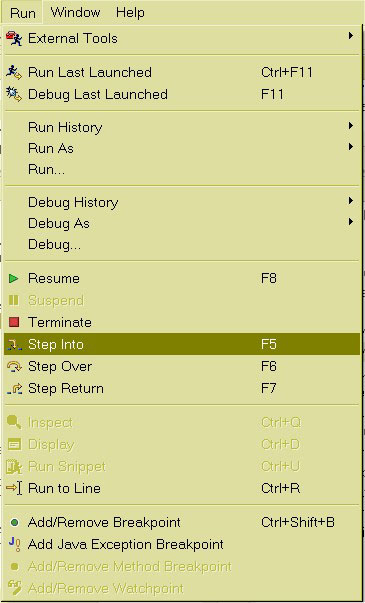
To suspend the execution of threads in the Debug view, select a running thread and Click the Suspend button in the Debug view toolbar. The current call stack for the thread is displayed, and the current line of execution is highlighted in the editor in the Debug perspective.
When a thread is suspended, the cursor is placed over a variable in the Java editor and the value of that variable is displayed in a small hovering window. Also, the top stack frame of the thread is automatically selected and the visible variables in that stack frame are displayed in the Variables view. You can examine the appropriate variable in the Variables view by clicking its name.
Hotswap Bug Fixing: On-the-fly code fixing
If you are running JVM 1.4 (Java Virtual Machine), Eclipse 2.0.2 and 2.1 offers a new feature called Hotswap Bug Fixing (not available in JVM 1.3 or lower – see also Figure 9). It allows the changing of source code during a debugger session, which is better than exiting the application, changing the code, recompiling, and then starting another debugging session. To use this function, simply change the code in the editor and resume debugging. This feature became available because JVM 1.4 is compatible with the Java Platform Debugger Architecture (JPDA). JPDA implements the ability to substitute modified code in a running application. This is of course particularly useful when it takes a long time to start your application or to get to the point where it fails.
Figure 9. The Hotswap Bug Fixing feature doesn't work with JVM version 1.3 and lower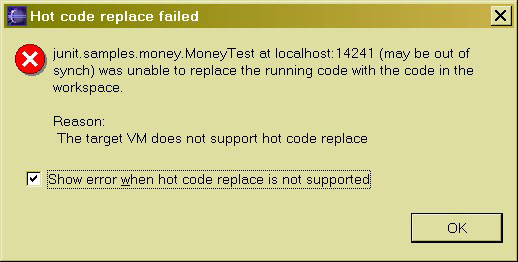
If the program has not fully executed when you are done debugging, select the Terminate option from the context menu in the Debug view. A common mistake is to use Debug or Run instead of Resume while you're in a debugger session. This will launch another debugger session rather than continuing the current one.
Remote debugging
The Eclipse debugger offers an interesting option for debugging remote applications. It can connect to a remote VM running a Java application and attach it to the internal debugger. Working with a remote debugging session is largely similar to local debugging. However, a remote debugging configuration requires different settings in the Run > Debug… window. You need to first select the Remote Java Application entry in the left-hand view and then click the New button. A new remote launch configuration is created and three tabs are shown: Connect, Source, and Common.
In the Project field of the Connect tab, select which project to use as a reference for the launch (for source code lookup). In the Host field of the Connect tab, type the IP address or domain name of the remote host where the Java program is running. In the Port field of the Connect tab, type the port where the remote VM is accepting connections. Generally, this port is specified when the remote VM is launched. Select the Allow termination of remote VM option when you want the debugger to determine whether the Terminate command is available in a remote session. Select this option if you want to be able to terminate the VM to which you are connecting. Now when you select the Debug option, the debugger attempts to connect to a remote VM at the specified address and port, and the result is displayed in the Debug view.
If the launcher is unable to connect to a VM at the specified address, an error message appears. In general, the availability of remote debugging functionality strictly depends on the Java VM (Virtual Machine) that runs on the remote host. Figure 10 shows the setting of connection properties for a remote debugging session.
Figure 10. Setting connection properties for a remote debugging session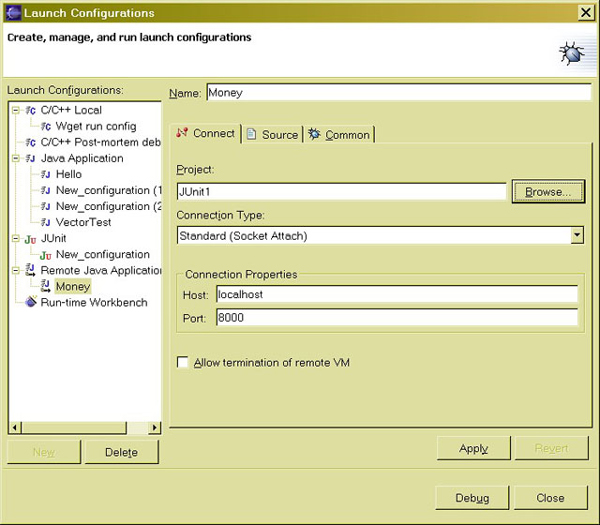
Debugging other languages
Java is the primary language for the Eclipse Platform. However, it is an extensible platform that can support many languages, the most important being C/C++ due to its popularity. Eclipse supports C/C++ through the C/C++ Development Tools (CDT). See Resources for a link. The CDT extends the standard Eclipse Debug View with functions for debugging C/C++ code, and the CDT Debug View allows you to manage the debugging of C/C++ projects in the Workbench. The CDT doesn't include its internal debugger, but it offers a front-end to GNU GDB debugger, which must be available locally.
Once you have downloaded and set up the CDT, you can start debugging the current C/C++ project (see Resources for a link to an article on setting up the CDT) by simply switching to Debug View. You will be able to set (and change at anytime during execution) breakpoints in the code and trace variables and registers. The Eclipse debugger displays the stack frame for the suspended threads for each target you are debugging. Each thread in your program appears as a node in the tree. It displays the process for each target you are running. Remember that GNU GDB is most effective when it is debugging a program that has debugging symbols linked to it. This is accomplished using the -g command line argument during compilation. For even more information use the -ggdb switch, which includes debugging symbols specific to GNU GDB.
If you want to debug servlets. use the Sysdeo Eclipse Tomcat Launcher. This plug-in enables you to manage a Tomcat 4.x/3.3 servlet container, creating and importing a Tomcat WAR project. It also registers a Tomcat process to an internal Java Eclipse debugger so you can easily debug Tomcat applications. There are a few other Eclipse plug-ins that enable the use of the internal Eclipse debugger for servlets, such as the Eclipse plug-in for Cactus, the Resin plug-in, and the X-Parrots ServletExec plug-in. Links for these plug-ins are available in Resources below.
Conclusion
The Eclipse Platform provides a built-in Java debugger with standard debugging functionality, including the ability to perform step execution, to set breakpoints and values, to inspect variables and values, and to suspend and resume threads. It can also be used to debug applications that are running on a remote machine. The Eclipse Platform is mainly a Java development environment, but the same Eclipse Debug view is also available for the C and C++ programming languages.
- Join the Eclipse Platform community and download the Platform at eclipse.org. The Eclipse Platform source code is licensed under the Common Public License. At eclipse.org, you'll also find a glossary of terms and descriptions of Eclipse projects, along with technical articles and newsgroups. The Eclipse Platform white paper details the major components and functions of Eclipse.
- Download C/C++ development tools at eclipse.org.
- Download the Sysdeo Eclipse Tomcat Launcher.
- Here are links to a few additional Eclipse plug-ins for servlets:
- View a categorized registry of Eclipse plug-ins.
- The following articles can help you get started with debugging in Eclipse:
- For an introductory article on the Eclipse Platform and how it works, see the developerWorks article “Working the Eclipse Platform” by Greg Adams and Marc Erickson.
- To get started with developing applications using the Eclipse Platform, see the developerWorks article “Getting started with the Eclipse Platform” by David Gallardo.
- To learn about the Launching Framework in Eclipse, see the eclipse.org article “We Have Lift-off: The Launching Framework in Eclipse“.
- For more on product builders and natures, see the eclipse.org article “Project Builders and Natures“.
- If you are developer and want to participate in discussions relating to the implementation of different Eclipse components, visit the developer mailing lists created for each of the components in the project.
- Find more resources for Eclipse users on developerWorks.
| About the author: Paul Leszek, a Studio B author, is an independent software consultant and an author specializing in Linux/Win/Mac OS system architecture and administration. He has experience with many operating systems, programming languages, and network protocols, especially Lotus Domino and DB2. Paul is also the author of series of articles for “LinuxWorld” and a Linux columnist for the Polish edition of “PC World.” Paul lives in Warsaw with his wife and sweet little daughter. Questions and comments are welcome; e-mail the author directly at [email protected]. |
First published by IBM developerWorks. Reproduced by LinuxDevices.com with permission.
This article was originally published on LinuxDevices.com and has been donated to the open source community by QuinStreet Inc. Please visit LinuxToday.com for up-to-date news and articles about Linux and open source.