Podcast explores memory and kernel profilers
Mar 7, 2008 — by Eric Brown — from the LinuxDevices Archive — 1 views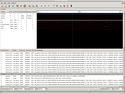 TimeSys has published another episode in its LinuxLink Radio series of free, half-hour podcasts about embedded Linux development. In Episode 30, Gene Sally and guest host Jeremiah Lott discuss profiling tools that can help to optimize the Linux kernel.
Sally and Lott start off “Profiling Tools — Hardware Efficiency” by explaining that profilers enable developers to optimize performance when everything else has been tried. “They let you poke around and make intelligent changes,” explains Sally.
“You're really stabbing in the dark without some good profiling tools,” agrees Lott. “Otherwise, you have to try to guess where the problem is and you could end up wasting time changing code that was not that inefficient to begin with.”
The two main profilers described are LTTng, which is based on LTT, and Oprofile. Together, Sally and Lott explain, these two profilers will serve most of a developer's needs for memory and kernel profiling.
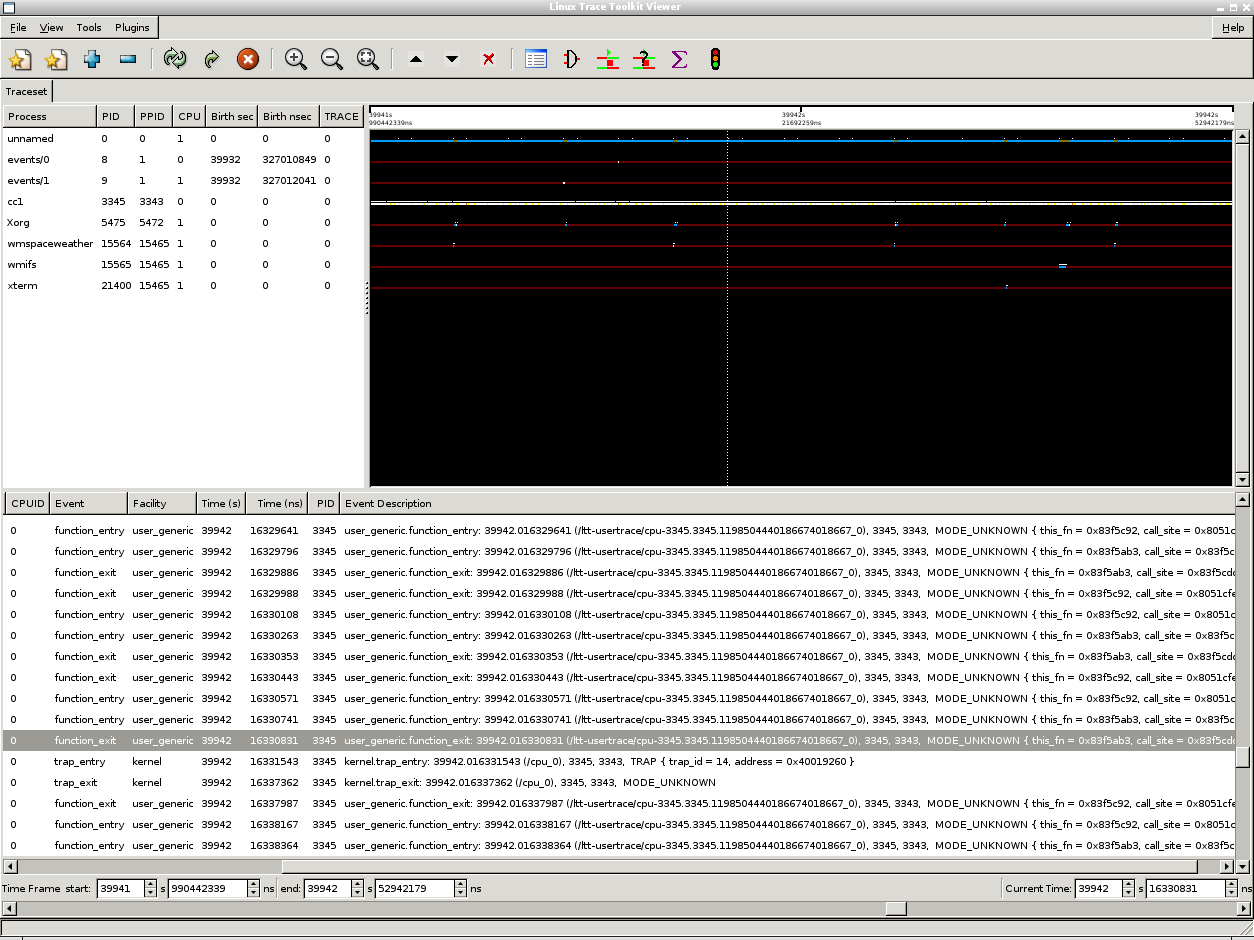
Linux Trace Toolkit, next generation
(Click to enlarge)
LTTng, explains Sally, is a Linux trace toolkit, a set of patches that developers can add to the kernel to expose performance counters. Occasionally, the counters are collected so developers can track how each is “tickled.” All this is communicated in a timeline interface that shows blow-by-blow stats. For example, says Sally, “It lets you spot interrupt handlers that are masking interrupts for too long.”


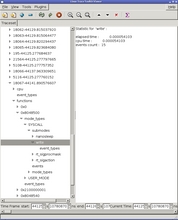
Oprofile output, system-wide and single-application
(Click either to enlarge)
Whereas LTTng looks in detail at performance issues, Oprofile provides a bird's-eye view. “It tells you how much time the kernel is spending doing something on an aggregate basis, in percentages,” says Sally. “It's pretty high level.”
“There are times when you want a more aggregate view,” says Lott.
After examining the use of these profilers for kernel analysis, Sally describes their use “over in userland.” Both tools, he says, “let you see kernel as they run normally, but you can also run the application and they will correctly tickle the files, and you can watch things go from userland into the kernel and back out again.”
When using the profilers with applications, says Lott, “you can see the direct effect of your program in terms of sys calls in the kernel,” he says. “And they can profile the whole system instead of just a single application.”
Both developers agree that the best way to run profilers is to turn off all optimization. “It's a good way to analyze the generic logic of the program,” says Lott.
The rest of the podcast covers a discussion of various other profilers, especially heat profilers which look for leaking memory. One particular good one they agree on is Electric Fence. They also agree, however, that most of the dozens that are available are pretty effective, one reason why some of the good ones “have been around since the Clinton administration,” says Sally.
The podcast for LinuxLink's Episode 30, “Profiling Tools — Hardware Efficiency,” is available here.
This article was originally published on LinuxDevices.com and has been donated to the open source community by QuinStreet Inc. Please visit LinuxToday.com for up-to-date news and articles about Linux and open source.