Europe tops global open source survey
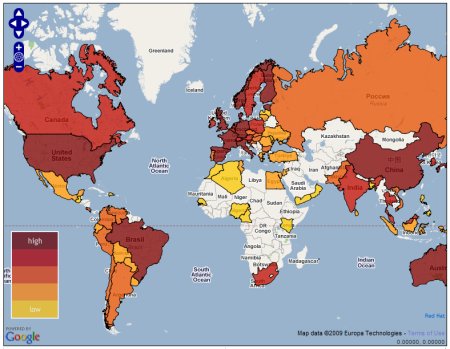
Apr 23, 2009 — by Eric Brown — from the LinuxDevices Archive — 15 views Red Hat and Georgia Tech have published a study that measures open source activity around the world. The Open Source Index (OSI) is accompanied by an interactive map (pictured) that shows the relative rankings for 75 countries based on their open source software (OSS) activity.
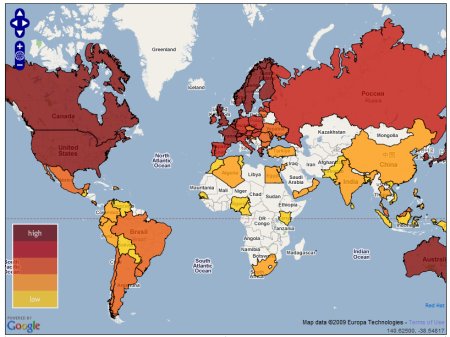
The OSI assigns each of the nations an overall ranking on two maps, with two different set of criteria. Activity (pictured above and directly below), looks at concrete measures of current activity, while Environment (pictured farther below), is more speculative, and aims to show where OSS is likely to grow most quickly in the future. In each case a final score is given that combines the community, government, and industry factors.

Open Source Activity Map (Source: Red Hat, Georgia Tech, and Europa Technologies)
(Click to enlarge)
In the Activity map above, government factors include support for OSS procurement policies, while the industry category includes the number of registered OSS users per capita, as well as Internet growth. Community factors include the number of applications to the Google code base, native language support for GNU/Linux, and the number of Internet users per capita, says Red Hat.
When these scores are combined, France is the leading open source stalwart, followed by Spain, Germany, Australia, Finland, and the UK. In the Western Hemisphere, the U.S. leads with a #9 ranking, while Brazil is right behind at #12, and Canada trails at #28. In Asia, the leader is Japan (#14), followed by China (#15), South Korea (#20), and India (#23). South Africa ranks at #30 while Russia lags at #42.
Stark differences appear between certain nations' government policies supportive of OSS vs community and industry involvement. The U.S., for example, which trails only Estonia in community involvement in OSS, and has a respectable #13 ranking in industry, ranks #28 in government activity. (In the future-looking Environment chart below, however, Uncle Sam appears set to take a more proactive stance.)
The Chinese government, in contrast, actively pushes open source technology, but its industry ranking, which also reflects the user base, ranks near the bottom at #69. The leading European countries are also skewed toward the top of the ranking by strong government and community support, which overshadows their middling industry rankings. The key exception here is Finland, which ranks first in industry (followed by Norway and Singapore), but #19 in government support.

Open Source Environment Map (Source: Red Hat, Georgia Tech, and Europa Technologies)
(Click to enlarge)
Looking forward: Environment for growth
The more speculative Environment map, which reflects factors including total number of Internet users and information technology patents, attempts to evaluate which countries offer favorable environments for open source growth. The map is roughly similar, but shows some interesting trends, with Sweden jumping out to a #1 ranking, followed by the U.S. (moving up from #9 in the activity map) and Norway. Other notables include Canada, which moves from #28 to #10, and Russia, which jumps from #42 to #27, largely due to greater government activity. Interestingly, both China and India fade considerably in these future-looking rankings.
The countries that do not appear on the list are missing only because there was not sufficient data to analyze, says Red Hat. In short, some open source surprises may be lurking out there.
Beyond the “Linux is for cheapskates” theory
The OSI report does not draw conclusions from the data except to note that “open source is widespread and thriving.” While it is true that the survey shows that open source is widely disseminated, the data also appears to indicate a general correlation between open source usage and the more affluent, technologically advanced nations.
This is not entirely surprising considering that, for example, the industry score appears to be based on OSS users as a percentage of the population, not as a percentage of technology users. Still, it helps to dispel the notion that open source only thrives in nations where governments, organizations, companies, and individuals are less capable of affording the higher costs of commercial software. In short, there appears to be more than cost behind the allure of open source software.
Availability
The Red Hat page with the two interactive maps may be found here. A tabular version of the data is available here, and the full report on the project may be found here.
This article was originally published on LinuxDevices.com and has been donated to the open source community by QuinStreet Inc. Please visit LinuxToday.com for up-to-date news and articles about Linux and open source.